Helping student writers create their own primary research
Are you smart enough to spell these words? Which Disney princess are you? Are you an official bookworm? Which flower matches your personality? Quizzes, questionnaires, and surveys are all the rage for the over-thirty crowd on Facebook.

Taking surveys can be loads of fun. Who doesn’t want to know what their exact wedding date will be just by naming their playlist of five favorite songs?
In the classroom, making surveys can be an excellent exercise in higher-order thinking.
Unfortunately, most students don’t have the chance to conduct their own research. Instead, they rely on the work of others, secondary research. Granted, students cannot create a double-blind, peer-reviewed, incontrovertible study, but learning how to create objective surveys is a worthy and valuable goal. It gives students background in how credible surveys are constructed, and it helps them evaluate potential sources.
Back in the days when I taught AP Language and Composition, my students had to create their own primary research, all three types. They had to complete an observational study, a survey, and an interview to support their long argumentative papers. The surveys generated several days of work creating questions that were appropriate, applicable, and useful. Then collating the responses from paper questionnaires added another couple of class periods.

I still have a photo of the desks lined up in long rows with students tallying answers to one specific question and then passing along the paper to the next person to record an answer to the following question. Tedious, but essential processing work.
As soon as we could, we switched to using SurveyMonkey. What a blessing that was when it came to collating responses!
Today, Google Forms makes all of that work so much easier.
In the past several years, my Speech classes created audience demographic surveys for their informational speeches. They were required to include a minimum number of questions, with at least one of each of the three different types of questions: open-ended, fixed response, and scaled. Beforehand, we discuss questions that ultimately reveal the same information, inherent bias in surveys, and what could be considered offensive. We also discuss why even numbers are better in scaled questions, and how the placement of questions impacts the answers. This work allows a depth of planning and thought usually not seen in their speech or composition planning.
After creating and sharing their survey links, students must interpret the results. This is where Google has it in spades!
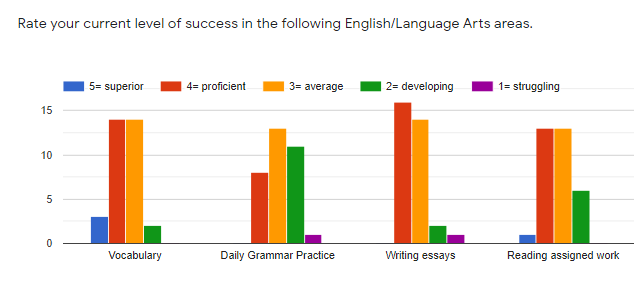
The survey results are provided in both chart form and spreadsheet form. Pie charts and graphs easily allow students to see the results of their questions. The spreadsheet function allows them to sort respondents by various demographic elements.
Once they had analyzed their survey results, my students wrote a paragraph that explained how the survey would impact their argument, their organization, and/or their contents to better appeal to their unique audience.
It’s another exercise in rhetoric that ultimately makes students better communicators.
How do you use Google Forms to help your students be better writers? How does Google Forms make you a better teacher?

Leave a comment